chart_create
Create new chart handle.
Syntax
chart_create(type, x, y, width, height)
| Argument | Description |
|---|---|
| type | The type of chart |
| x | The x position the chart will be created at. |
| y | The y position the chart will be created at. |
| width | The width of the chart. |
| height | The height of the chart. |
Return: Real
Description
With this function you can create a new chart handler of the specified object at any given point within the room. This function returns a ds_map data structure which can then be stored in a variable or used to access that instance.
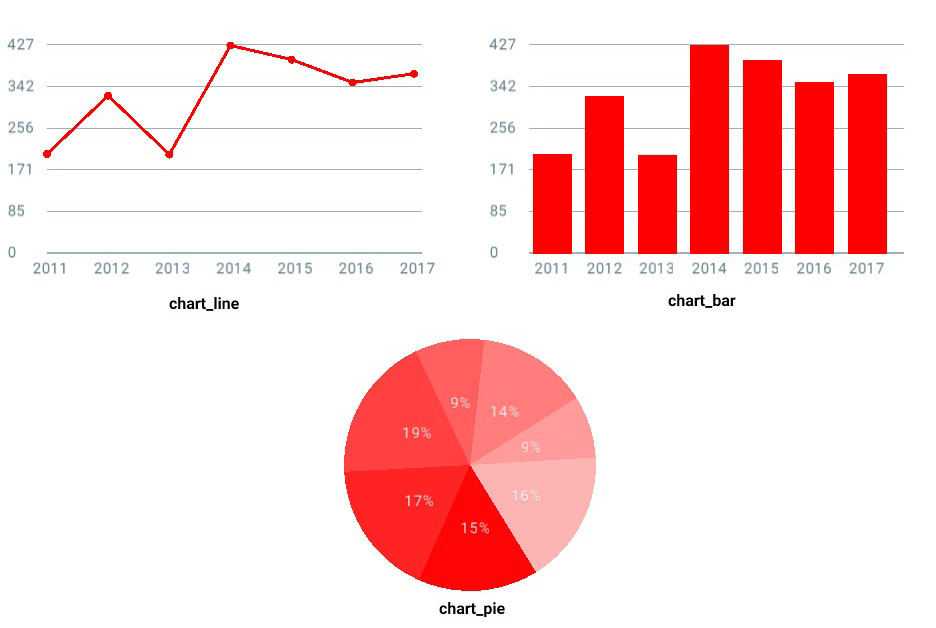
There are 3 type chart you can define with the following constants:
chart_lineto crete a line chart type.chart_barto create a bar chart type.chart_pieto create a pie chart type.
The following image illustrates basically how these should look:
Example
chartBalanced = chart_create(chart_pie, 32, 16, 448, 256);
The above code creates a new line type chart and stores the id in a variable. This variable is then used to assign chart properties.